- Home
- News and Insights
- Archive: News and insights
- Making business reports user friendly
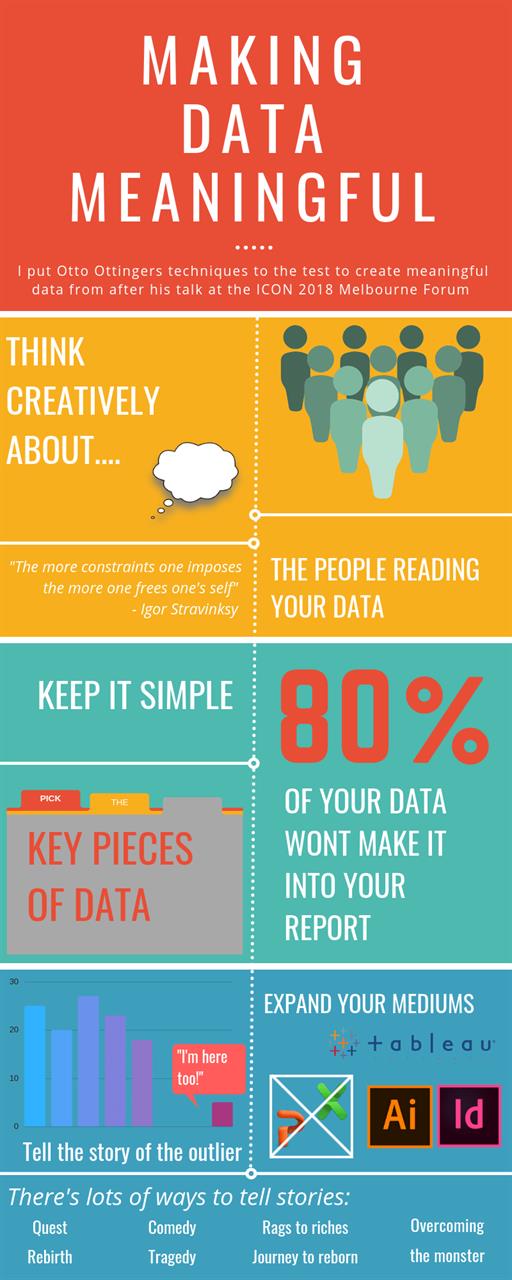
Reports can be essential tools for marketing your brand, so it’s important to differentiate yours from all the others. Engaging readers while communicating all the right information can be achieved by making business reports user friendly. Otto Ottinger, Managing Director and co-founder of Datalabs Ventures and Datalabs Agency, specialises in creating real-time interactive dashboards and data tools, and innovative visual reports. He spoke about data digitalisation at the recent ICON Melbourne Forum 2018. |
There is no right or wrong way to be creative, but there some ways to make your data easier for your audience to consume. Data visualisation involves remodelling complex data to make it more accessible for a wider audience, often by condensing heavy analytical data into one or two pages of charts or an infographic. Alternatively, you can design a whole website or report so that it’s completely interactive, allowing readers to access all the information with very minimal interaction. Here are some of Ottinger’s other tips for making data as user friendly as possible. 1. Start the first design with pen and paperUsing a pen and paper really helps stimulate creativity, and gives you more freedom to scribble down your ideas. 2. Create a framework from your design, then tweak it Consider what has worked before. Build a framework and then adjust it to suit your design. Think about what didn’t work well last time – were the images overcrowded? – and make an effort to avoid repeating any errors. 3. Start in monochrome Colour is one factor you will need to think about when creating a design, but it’s better to think it after you have the basics sorted out. 4. Steal (take inspiration) from the best Use as many different styles and sources as you need to inspire you. 5. Think of the user, and design from their point of view Consider what the user is going to take away from reading your report, and what are they going to gain from viewing your data. 6. Answer the questions you often get asked Think about what questions people frequently ask and answer them in your design. Make sure you address the ‘what, when and where?’ questions to create a story. Remember that when you write a report, you are trying to engage another human, not a machine. Once you’ve established who your audience is and how they will consume the information, you can start to think about the creative process. People relate best to stories, not numbers. Some helpful narrative structures you could use include the quest, the tale of rebirth, a rags-to-riches story, a journey and the defeat of an enemy. These might sound a bit farfetched for a business report, but they can be a good framework for engaging your audience. Consider a narrative that hasn’t been told before, and frame it around the outliers instead of the majority. Even with all the numbers and charts, real humans need to understand your data. It’s a good idea to expand your production media; PowerPoint and Excel may not be the best platforms for your audience, and they are not the best tools for creating visual data breakdowns. Consider using platforms such as Adobe Illustrator or InDesign, or Tableau. Put effort into your designs, think of yourself as a creator, and try to avoid unnecessarily complicated 3D images or charts. You could even consider accenting your message with a short moving image or GIF (Graphic Interchange Format). Simplicity is the key to converting data into information that is easy to understand. Your readers are busy and may have a lot of other things going on, so simple visual platforms are a great way to connect with them. Pick out the key pieces of information and share the most relevant points, remembering that 80% of the data you have will become irrelevant once you create the final story. It’s great if a viewer remembers three things from your data; if they remember just one then you’ve done your job. |
|
This Insight is related to the ICON Melbourne Forum. For more information on this event please click here. Make sure you follow our social media pages to get the latest updates from the ICON community. |